As part of our programming essentials we learned about activity diagrams (flow charts). These are a simpler way of showing what your code does. In our lesson yesterday we had to create our own diagram, and then program it aswell. As I am not very good at programming I wanted it to be nice and simple, or so I thought.
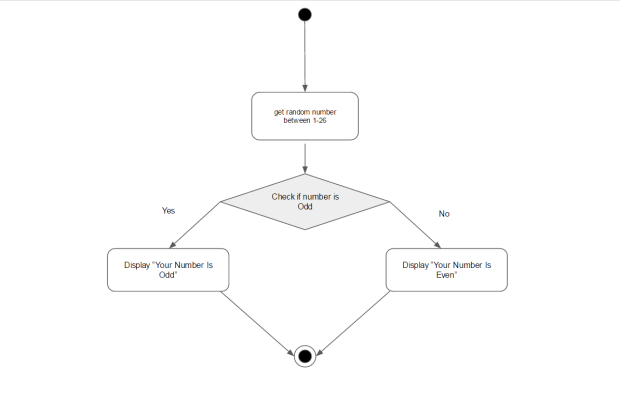
This is my flow chart – My friend Nathan helped me design it
If you do not want to read the flow chart. It basically means that we get Unity (the program we will be using) to generate a number between 1 and 25. If the number is even, it displays the number and tells you it is even. It does the same with odd numbers.
Generating a Random Number
First of all we needed to generate the number we would be using. To do this we would use the Random.Range command.
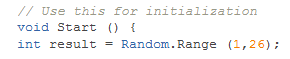
The first part of this code is creating a variable called result. The second part is then defining what result contains / holds. In this case a random number between 1 and 26.
Did we get even?
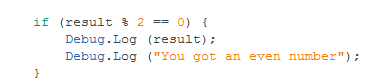
This and the next part of the code use a method known as modulus. When you divide a number, it gives you a remainder. Thus, if we divide our random number by two and get no remainder the number must be even, if we get a remainder of 1. It is an odd number. This is how we do this process.
Debug.Log
This is simply outputting to the developer console what the result will be. Here is the same code, but for an odd number result.

In Action
Here is the script in action: